Measurement and Control Engineering – Mechatronics Working Group
Prof. Dr.-Ing. Oliver Nelles
Research Topics: Geritt Kampmann
Robust One- and Two-Class Classifiers via Zero Leave-One-Out Cross-Validation Errors
One-class classifiers [1, 2] are often used to detect changes in data over time (novelty detection). If the data is collected online via sensors on a technical system, these changes may be caused by environmental factors (e.g., temperature) or by changes in the system itself that indicate the need for maintenance or even an imminent malfunction.
Another application of one-class classifiers is the detection of extrapolation when using models generated from data. If a model output is calculated for input data that lies far from the data used for training, a rather large model error should be expected. The results should be used with great caution, depending on the application.
For this type of application, the use of Radial Basis Function (RBF) Networks is proposed [3]. In the simplest case, a Gaussian function is assigned to each data point, and the classifier is a weighted sum of all these Gaussians. The weights (parameters) can be calculated efficiently using regularized least squares (ridge regression). Regularization is necessary because the number of parameters equals the number of data points, which causes overfitting of the data and numerical problems if data points are (almost) identical.
The problem arises, however, that before the weights of the RBF network can be calculated, two hyperparameters must be determined:
the standard deviation of the Gaussians, σ, and
the regularization strength λ.
The effect of the regularization strength can be seen in Fig. 1. As λ increases, the weights decrease, resulting in a more robust estimate, but also leading to tighter boundaries and, if taken too far, to misclassifications (Fig. 1, bottom right).
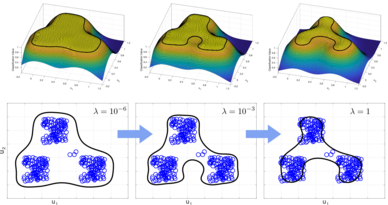
Figure 1: Influence of the regularization strength λ on the classification boundary.
The influence of the standard deviation is shown in Fig. 2. From top left to bottom right, σ is reduced, causing the boundary to move closer to the data. Depending on σ, the data is separated into one, two, three, and even four groups, before (in the bottom-left diagram) the data finally begins to break down into an undesirable number of random fragments.
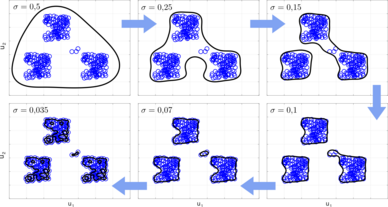
Figure 2: Effect of the standard deviation σ on the classification boundary.
The question remains: how to select the hyperparameters in a useful way. Based on the range of the data, the number of data points, and the number of dimensions, the useful range for σ can be roughly bounded. Also, the useful range for λ is rather limited. Consequently, it is usually possible to iterate through an acceptable number of hyperparameter combinations to find a suitable one. But how can we determine what is suitable? One good strategy might be:
- the classification error on the training data should be as close to zero as possible,
- the classifier should be robust! If a single data point were removed from the training set, all remaining data points (including the one removed) should be classified correctly.
The last requirement means that the leave-one-out cross-validation (LOOCV) error should be zero. Usually, it is very inefficient to calculate the LOOCV error, because the classifier has to be trained and evaluated once for every data point. However, for least-squares problems, it is possible to calculate the LOOCV error directly for the entire dataset as a byproduct of the weight calculation.
The following procedure is proposed for one-class classification:
- The target classification value for all data points is 1.
- The classification threshold can be chosen freely, but must be less than 1, e.g., 0.95.
- The training error and LOOCV error are calculated for all combinations of the hyperparameters.
- The hyperparameters with zero (or the smallest) training error and zero (or the smallest) LOOCV error are selected.
- From these, the ones with the smallest σ are selected to ensure a tight boundary.
- From these, the one with the largest λ is selected to ensure maximum numerical robustness.
An example is shown in Fig. 3. The bottom diagram indicates the hyperparameter regions that result in either training errors (and LOOCV errors), only LOOCV errors, or no errors.
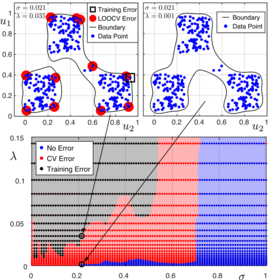
Figure 3: Hyperparameters σ and λ chosen by the proposed method.
The top-right diagram shows the classification using the hyperparameter combination selected with the presented strategy (the top-left parameter combination in the blue area). As an example, the top-left diagram shows a classification using a combination of hyperparameters in the training error region (which also includes LOOCV errors) that is close to the LOOCV error region. In fact, one point is misclassified, and 11 points very close to the boundary would be misclassified if they were not part of the training data.
A modified version of the procedure is proposed for two-class classification.
- The target classification value for all data points in one class is 1; the target value for the data points in the other class is -1.
- The classification boundary is zero.
- The training error and LOOCV error are calculated for all combinations of the hyperparameters.
- The hyperparameters with zero (or the smallest) training error and zero (or the smallest) LOOCV error are selected.
- From these, the ones with the largest σ are selected to ensure the smoothest boundary.
- From these, the one with the largest λ is selected to ensure maximum numerical robustness.
The main difference here is that the hyperparameters with the largest σ are chosen instead of the smallest. Choosing the largest possible σ is desirable because it leads to the smoothest—and therefore most robust—classification boundary. However, this strategy is not feasible for one-class classification, since in this case a sufficiently large σ always ensures zero training and LOOCV error. But the boundary, in this case, is simply pushed far away from the data points. Since a tight boundary is desirable, this approach becomes useless for classification.
Structural Health Monitoring (SHM) Using Probability Density Estimation
Mechanical structures under continuous dynamic loading can suffer sudden catastrophic failure. Therefore, they must be inspected regularly for potential damage, and critical components may need to be replaced at regular intervals—even in the absence of visible damage—to ensure safety. This costly process can be improved by continuously monitoring the structure’s health using sensors and data processing.
The operation of trains, for example, requires regular inspections of the rail cars’ bogies to prevent derailment—such as that caused by a defective suspension. Degradation of springs or dampers can be detected by mounting acceleration sensors on a bogie’s frame and estimating the natural frequencies and modes of the mechanical system; see Fig. 4.
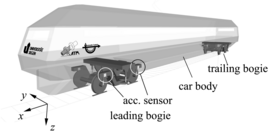
Figure 4: Model of a train car with (simulated) acceleration sensors on the leading bogie.
The proposed structural health monitoring (SHM) system was tested in simulation using a (SIMPACK) multibody model of a train car with two bogies and a simulated rail track (ground and track model) [4]. The accelerations at two positions were calculated for a nominal suspension and for several cases in which the suspension springs were weakened to varying degrees. Using an input-free subspace identification technique [4,5] (where the input is assumed to be white noise), the natural frequencies and modes are estimated for short segments of the available data. In this way, an SMH procedure is simulated that would operate online on a train.
For the subspace model used in the identification process, a suitable model order must be assumed. One commonly used method is to estimate the natural frequencies with an increasing model order until the natural frequencies stabilize at certain values. This procedure is usually aided by a stabilization plot in which the estimated natural frequencies for each model order are plotted on top of one another.
After collecting a sufficient number of fault-free (nominal suspension) data sets and estimating the natural frequencies for each set, it becomes clear that the results vary from one data set to another. This is caused by model error and changes in the excitation of the dynamic system resulting, for example, from speed, track curvature, subsoil conditions, and so on. To mitigate this, it is proposed to estimate the natural frequency density [6], which indicates how likely natural frequencies are to occur within certain value ranges. As an example, Fig. 5 shows natural frequency densities calculated from several data sets containing either a fault-free or faulty suspension. The fault-free natural frequencies are shown as circles in the plot, and the corresponding density is shown as a solid line. The faulty natural frequencies are shown as triangles, and the corresponding density is shown as a dashed line.
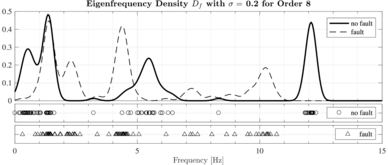
Figure 5: Density of natural frequencies for fault-free and faulty cases.
Although the circles and triangles often overlap, it is evident at first glance that the densities for the two cases differ significantly. This characteristic is used in the proposed SHM scheme to determine whether new measurements indicate a fault-free or faulty suspension. This approach is illustrated in Fig. 6. The squares at the bottom of the plot represent the four natural frequencies calculated from a newly acquired data set. At these four frequencies, the values for both densities are determined, and the average values are calculated accordingly. It is now reasonable to assume that the new data set corresponds to the case with the highest average density value, which, in this instance, would indicate that the suspension is fault-free.
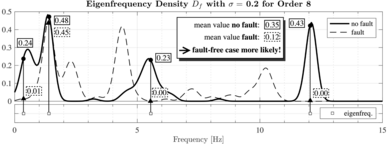
Figure 6: Determining whether a newly estimated set of natural frequencies corresponds to a fault-free or faulty case.
The eigenfrequency density is calculated by placing one Gaussian distribution on each eigenfrequency (the expected value equals the eigenfrequency) in the data set under consideration. Taking the mean of all Gaussian distributions results in an overall probability of one. For this calculation, the standard deviations of the Gaussians must be chosen appropriately. This can be done by minimizing the classification error using a cross-validation approach. The data sets are repeatedly and randomly divided into two groups. One group is used to calculate the density (training data), and the other to calculate the classification error (validation data).
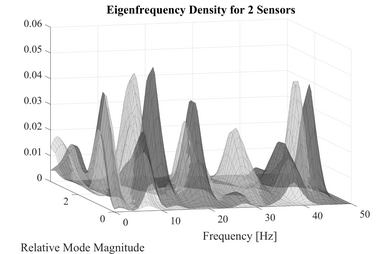
Figure 7: Using two sensors allows for a two-dimensional density plot of frequency versus relative mode magnitude.
The SHM procedure described so far requires only one sensor. With additional sensors, not only the natural frequencies but also the natural modes are available for fault detection. With one additional sensor, two values for the mode can be calculated. As shown in Fig. 7, the relative mode magnitude (ratio of the two mode values) can now be used to calculate a two-dimensional density function. The two cases—fault-free (dark gray) and faulty (light gray)—are visibly even better distinguished from one another than in the one-dimensional case, allowing for a more precise classification. Future research will investigate whether the use of additional sensors will provide a method for reliably detecting different types of faults or fault locations.
References
| [1] | David M. J. Tax. “One-class Classification.” In: Thesis, Delft University of Technology, 2001 |
| [2] | Geritt Kampmann, Oliver Nelles, “One-Class LS-SVM with Zero Leave-One-Out Error,” in IEEE Symposium Series on Computational Intelligence, 2014 |
| [3] | Volker Smits, Max Schüssler, Geritt Kampmann, Christoper Illg, Tim Decker, and Oliver Nelles. “Excitation Signal Design and Modeling Benchmark of NOx Emissions of a Diesel Engine,” in CCTA 2022—IEEE Conference on Control Technology and Applications, 2022 |
| [4] | Henning Jung, Tobias Münker, Geritt Kampmann, G, Kevin Rave, Claus-Peter Fritzen, and Oliver Nelles. “A Novel Full-Scale Roller Rig Test Bench for SHM Concepts of Railway Vehicles.” In: e-Journal of Nondestructive Testing, 2016, 21 |
| [5] | Peter Van Overschee and Bart De Moor. “Subspace Identification for Linear Systems.” In: Kluwer Academic Press, 1996 |
| [6] | Henning Jung, Tobias Münker, Geritt Kampmann, Oliver Nelles, and Claus-Peter Fritzen. “A probabilistic approach for fault detection of railway suspensions.” In: International Workshop on Structural Health Monitoring, 2017 |