Measurement and Control Engineering – Mechatronics Working Group
Prof. Dr.-Ing. Oliver Nelles
Research Topics: Fabian Schneider
Data-Driven Optimization of Multi-Stage Forming Processes
Modern development methods increasingly incorporate model-based optimization strategies. In this approach, a model predicts the desired output of a process for given or selected process parameters, which are used as model inputs. Subsequently, a suitable optimization method is applied to determine, based on the model, the process parameters that yield the optimal process results.
Such a data-driven optimization approach is applied to multi-stage forming processes. One particular quality measure is the equivalent plastic strain ϵpl, which describes the deformation of the raw material. Since it is impractical to measure ϵpl during a forming process, physics-based first-principles models are used to calculate it, typically through finite element analysis (FEA); an example is shown in Figure 1. Unfortunately, FEA is not well suited for optimization processes. The computational costs of a simulation are too high. A data-driven model can significantly reduce computational costs compared to a physics-based model. Most data-driven models are computationally inexpensive and quick to evaluate. In this case, the data-driven model is a metamodel—a data-driven representation of a first-principles-based model (FEA). The typical training setup for a metamodel is shown in Figure 2. The model created should be able to predict the distributions of the process variables (e.g.,ϵpl). This is important because the loss function can change during the development process. In addition, the spatial distribution also influences process quality. To enable the modeling of such a spatial distribution of the process variables in 2D or even 3D, it is compressed into a two- to five-dimensional feature vector using an autoencoder. This feature vector can then be approximated using a second model. This can be performed at different points in time for each simulation. In this way, it is possible to predict the distribution of the process variables over time. Based on this overall model, process optimization can be performed quickly and efficiently. An example of metamodel predictions is shown in Figure 3.
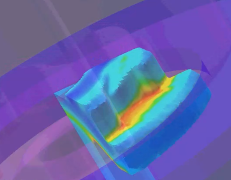
Figure 1: Finite element analysis of a forming process.
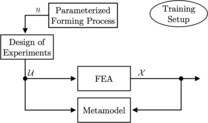
Figure 2: Training setup for a metamodel.
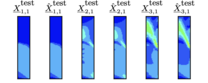
Figure 3: Metamodel prediction of a multi-stage forming process compared to the corresponding original data.
Growing Design of Experiments with 1- and 2-Class Classifiers
Many industrial applications have a restricted parameter space. This means that certain parameter combinations lead to destructive or undesirable process behavior and are therefore unfeasible. If a data-driven model of the process is to be generated, data must first be measured. At the same time, the exact process limits are often not yet known. These can usually be estimated using process knowledge or simulations, but often not with sufficient precision. This is the case with combustion engines, for example. In practice, a two-step procedure is therefore used. First, the design limits are determined during an initial measurement phase. In an intermediate step, a measurement plan is then created that takes these limits into account using a design of experiments. This measurement plan is finally executed in a second test bench run.
The method presented here combines both of the steps described above into a single step to reduce test bench time and cost. The parameter space is explored starting from a feasible (safe) initial point. To avoid excessive violations of the constraints, newly reached process points may only be located in the vicinity of points that have already been visited.
Three primary requirements must be met for most applications:
- Space-filling design
- Limited propagation speed
- Modeling of the constraint
Space-filling: To estimate high-quality, data-driven models of poorly understood processes with the smallest possible number of experiments, the valid parameter space must be covered completely and evenly. To achieve good coverage, each iteration selects the feasible point that leads to the best point distribution according to a space-filling criterion calledϕp.
Limited propagation speed: The transition to the unsustainable range of a process is often continuous rather than abrupt. A combustion engine, for example, runs unsteadily or begins to knock instead of failing immediately. This is why slight constraint violations are permitted during the measurement. A Robust One-Class Classifier (OCC) (Link) is used to ensure this. This OCC is trained on all feasible points in each iteration. Only a point close to the classification boundary is added in each iteration. The points for which this condition applies are called candidate points. From all candidate points, the one that optimizes the space-filling criterion is selected for the next measurement. The propagation speed can thus be controlled by adjusting the permitted distance to the (or all) previous measurement(s).
Modeling the constraint: A two-class classifier is used to model the constraint. This classifier can be trained as soon as a point becomes infeasible. It is also updated in each iteration. As soon as the classifier is available, only points within the estimated feasible parameter space are tested. Thus, the accuracy of the model improves as the procedure progresses.
The procedure for a two-dimensional example process is shown below in Figure 4. The infeasible parameter space is marked in gray. The boundary between the feasible and infeasible spaces is the black line. The black dots represent all points in the generated design. Red crosses mark tested points that are infeasible. Blue dots are candidate points from which new points can be selected in each iteration. The contour band visualizes the one-class classifier. The blue line is the classification boundary of the two-class classifier.
Result: The constraint can be modeled without violating it too much. The entire feasible parameter space is evenly covered with measurement points.
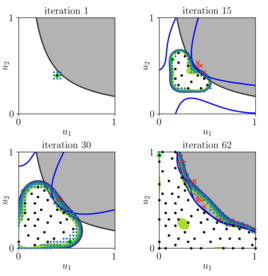
Figure 4: Example of a 2-dimensional search for a feasible parameter space.
LOLIMOT Lookup Tables
Lookup tables play an important role in static data-driven modeling. They are often used to describe nonlinear processes, such as the characteristics of combustion engines or the estimation of automotive battery resistance. In most cases, they are grid-based, meaning the support points lie on a regular grid. Each support point is associated with a height, which is the output value at the corresponding input. Generalization between the support points is performed using bilinear interpolation.
The popularity of lookup tables, however, stems from the following combined design of experiments (DoE) and modeling strategy, which is straightforward:
- Fix the granularity of all input variables, i.e., the number of levels for each axis.
- Establish support points at all level combinations (tensor product).
- Measure the process at all support points and set the heights equal to the measured outputs.
This strategy builds a model without any estimation or optimization step and is extremely simple. However, it requires the use of a grid-based measurement strategy. It is also possible to measure data arbitrarily, not on a grid. In that case, the heights at all support points must be estimated. If the support points have been fixed, this can be accomplished using least squares (LS). Grid-based approaches do not allow for local refinement, so many unnecessary points must be measured. The number of unnecessary points increases sharply as dimensionality increases. To make lookup tables much more efficient in these cases, the grid-based approach is replaced by the local refinement strategy of the LOLIMOT construction algorithm; see Figures 5 and 6. Thus, model flexibility can be increased only in the necessary regions, and less data is required in all other regions. The construction algorithm defines the support points. Consequently, the heights can be estimated using least squares and quadratic programming. It is also possible to measure the required support points directly. This results in an effective design-of-experiments strategy.
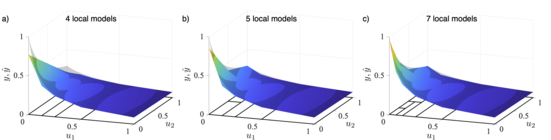
Figure 5: Model approximation and partitioning for a) 4, b) 5, and c) 7 local bilinear models.
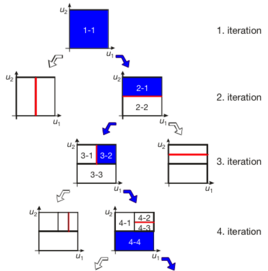
Figure 6: Local linear model tree (LOLIMOT) construction algorithm.